WTH: What the Hell is a 1-Percent Chance Storm?

I’m Not Noah, but let me give you a warning…

That’s how my Facebook post started recently. I had been looking at pictures of the flooding in Louisiana from August 10-13, 2016, and had lots of thoughts about the people in those areas. Scientists have classified this storm event’s recurrence interval as a 1,000-year storm in some places. Statistically this means that the event has a 0.1% chance of happening in any given year. In fact, this is Louisiana’s second such event THIS YEAR. And, there have been over eight flood events that are considered as 500-year (or 0.2% chance) storm events in the USA this year.

The death count is up to 12 as of now from the flooding. You should know that flooding is the second leading cause of weather fatalities, second only to heat, more than lightning, tornados and hurricanes. About 81 people a year on average die in a flood in the United States.

What is a 1-Percent Chance Storm Event?

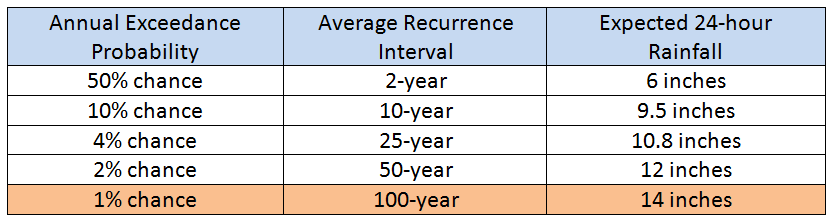
We engineers classify rain events by their probability of happening again in a year. For example, a 1-percent chance storm event statistically has a 1-percent chance of occurring in ANY GIVEN YEAR. This 1-percent chance storm event also has inches of rain associated with it for specific areas. For New Orleans, the 1-percent chance storm is 14-inches in a 24 hour interval. This storm event was called in the past the 100-year storm event. This is actually known as the Average Recurrence Interval of 100-years. If you say 1 in 100, that is equivalent to 1-percent.  It is statistically defined, and doesn’t mean that once you have a 100-year event you are good for your lifetime.  It can happen in any year, or multiple times per year.

Go to 100-Year Flood – It’s All About Chance for more information on this.

For New Orleans, here are the Probabilities, Recurrence Intervals, and Expected Rainfall for those certain rain events:

new-orleans-expected-storm-rainfall-table

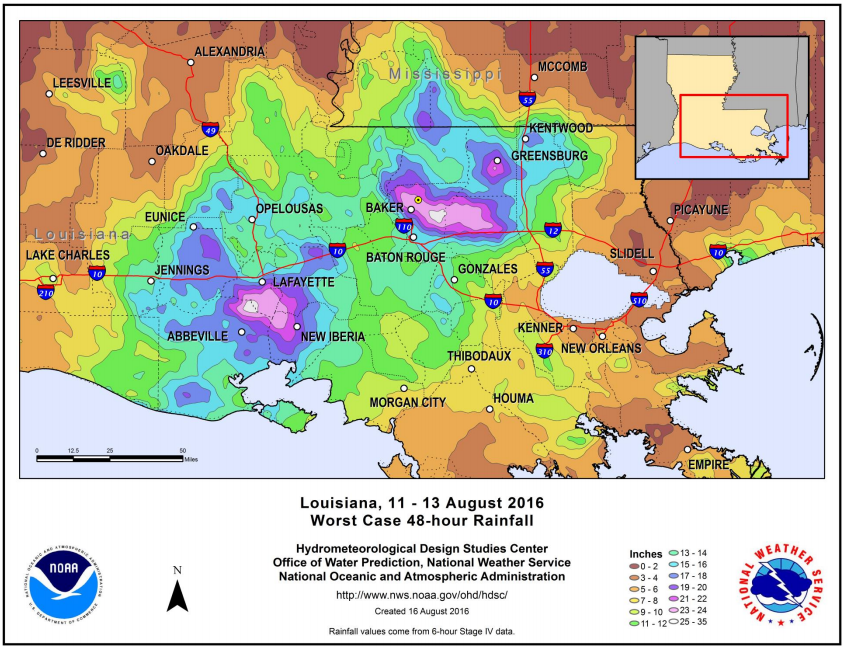
And, in further looking at the recent Louisiana event, I found this analysis by the National Weather Service. It showed that there was 25-inches to 35-inches that fell in 48 hours, greatly exceeding the 100-year event, and classifying the storm at some locations as a 1,000-year storm, or a 0.1-percent chance storm. (See the featured image on this article.)

nws-worst-case-48-hour-rainfall-11-13-august-2016

How Do I Tell if I’m in a Special Flood Hazard Area?

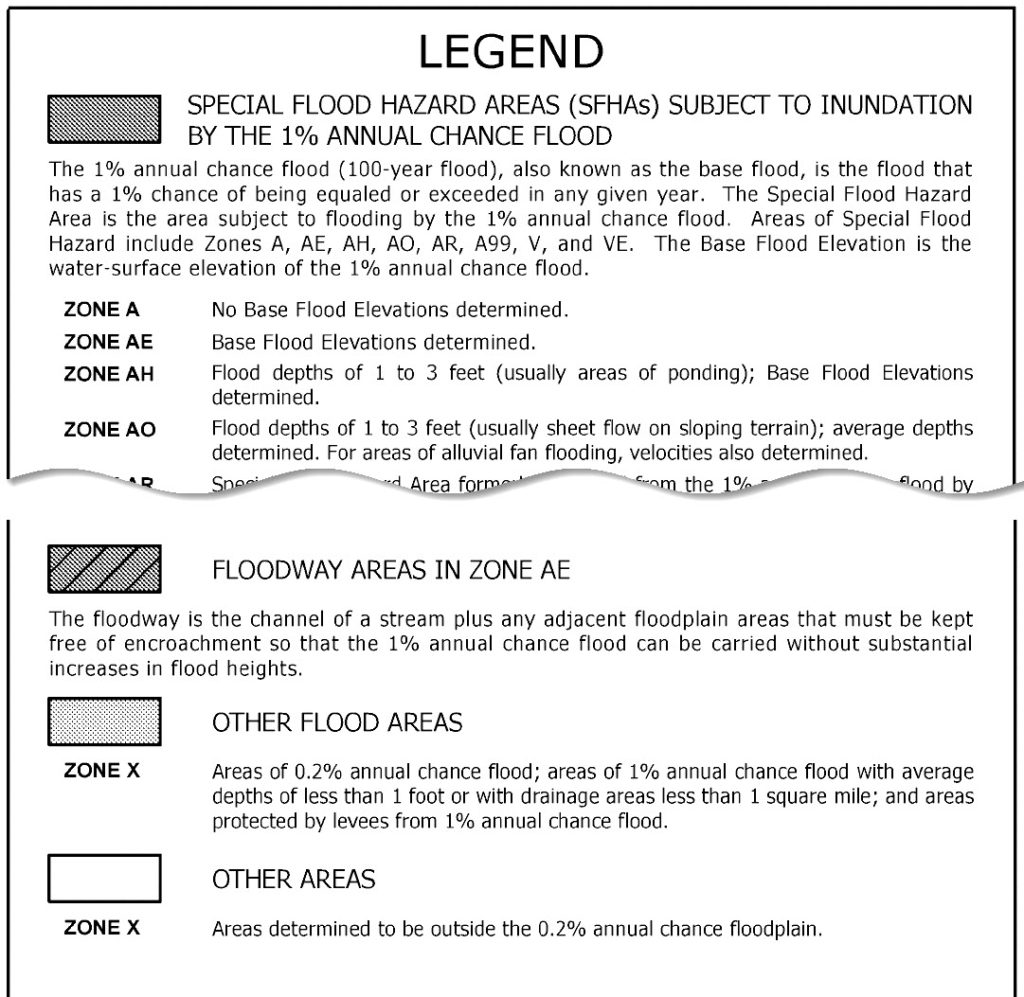
The Special Flood Hazard Area is the area shown on the flood map that is located lower than the Base Flood Elevation. This is the expected elevation of the 1-percent chance storm (100-year) water level. This area is determined by calculation of what level (elevation) that the creek will rise to during and just after the 1-percent chance rain event. Personally I would stay out of the 0.2-percent flood zone (500-year) as well. These flood zones are shown on FEMA’s Flood Insurance Rate Maps. and in my last article. The quickest way to find them is to go to the FEMA Map Service Center and enter your home address.

You will be presented with a portion of a map showing your location on it. At the top of the page you have 3 options to view the map. The “View Map” option is somewhat difficult to get used to zooming and moving around on, but if you’ll note what area of the flood map panel you’re in from the map on this page, it will be easier to find yourself. I prefer to “Save Map” which will save a TIFF image on your computer in a Zip formatted document. The “Interactive Map” is by far the easiest map to use to find your house.  Browsing on this map is very similar to most online maps.

For more information, call a local land surveyor and ask for an Elevation Survey & Certificate to be completed.

I’m Not Shown in the Flood Zone, So I’m Clear, Right?

Most likely, but there are some special things you should consider. First is, are you in an area that has a creek that hasn’t been studied as yet? All creeks and ditches have a point that the water will rise to during and after a 1-percent chance rain event. You could have a dry ditch that runs by your house that only has water in it when it rains. This ditch could also overflow during a large rain event. This dry ditch will probably NEVER show up on a FEMA Flood Insurance Rate Map. Many small streams are the same way. You should have a surveyor or engineer who is familiar with assessing flood risk to look at your property and the contour maps in your area. If you have any doubt, obtain flood insurance. It will be the cheapest premium they have, but worth every penny if you ever have any flooding issues. You are likely NOT covered for flooding risk by your homeowner’s policy.

You should know that 30% of the flooding claims processed by FEMA are for areas outside of the 1-percent chance flood zone.

Last Warning – Flood Facts

  • Most flood-related deaths are due to flash floodsdont-drive-through-flood-waters
  • Fifty percent (50%) of all flash flood fatalities are vehicle related
  • Ninety percent (90%) of those who die in hurricanes drown
  • Most homeowner’s insurance policies do not cover floodwater damage
  • Individuals and business owners can protect themselves from property losses by purchasing flood insurance through FEMA’s National Flood Insurance Program.


USA Land Surveyor


J. Keith Maxwell is a Professional Engineer and Land Surveyor in Alabama. He knows a thing or two about flooding and wishes he could show everyone looking for a house where not to buy…in OR NEAR a flood zone.

WTH: What The Hell is a Flood Study?

In the article “Study could lower or nix local flood insurance costs” we see a familiar situation that was finally resolved by ONE citizen paying for a flood study to help his neighbors. The situation was that…

Residents along Wolf Creek used to see more flooding until two dams along the waterway at North Street in Pine and East Main Street in Grove City were removed 11 and 12 years ago, respectively, and the waters have receded significantly. Since that time, the residents believe their insurance is no longer justified – or could at least be reduced.

Flood Zones Explained

FEMA’s Flood Insurance Rate Maps (FIRMs) determine the flood insurance rates that FEMA charges landowners who are located in a Special Flood Hazard Zone. This is also known as the 1% Chance Storm Flood Zone and is typically designated as Zone AE. The “E” means there is a Base Flood Elevation that has been established.

There are 3 situations you may find yourself in on a flood map:

  1. Out of the flood hazard zone completely, the best situation. This is usually designated as “X Outside the 0.2% Chance Flood Zone.” In this case you are not required to purchase flood insurance, though you may consider doing so if you have a wet weather drain close to your house.
  2. Your lot and/or house is shown in Zone “X Within the 0.2% Chance Flood Zone.” In this case you are also not required to purchase flood insurance but it is highly advisable. The 1% storm event is exceeded in many cases. (The water doesn’t know that it’s supposed to stop at that elevation.)
  3. A portion of your lot and/or home is shown in the flood hazard zone on the Flood Maps. This requires flood insurance, or proof that the maps are inaccurate. At this point your home may or may not be actually below the Base Flood Elevation, the 1% chance flood elevation.
    • Your lot is IN the flood zone, but your house and the Lowest Adjacent Grade (LAG) next to it is OUT, or ABOVE the Base Flood Elevation. This has to be determined by a land surveyor. If so, you may qualify for a LOMA to remove the requirements for flood insurance.
    • Your house and/or the Lowest Adjacent Grade (LAG) are BELOW the Base Flood Elevation. You won’t qualify for a LOMA. Get an Elevation Certificate by a land surveyor in order to determine your flood insurance premium.

fema-flood-map-legendA Fourth Flood Map Situation

In this article, a FOURTH situation is given; you are shown IN the flood hazard zone on the current maps but something has changed since the map was published that would show you to actually be OUT of that hazard zone. In this case, a flood study has to be undertaken to prove to FEMA that something has changed. Unfortunately this flood study has to be paid for by someone. If your City and/or County won’t do it, then it is up to you or your neighbors to undertake this study.

A Flood Study

A flood study is done by engineers who are trained and licensed to undertake these tasks. A flood study involves calculating the height which the 1% chance storm will rise to as it flows through the stream. You do this by taking measurements of the shape of the stream at various locations and determining the amount of water that will runoff the overall drainage area, and how fast it will get to that segment of the stream. Honestly, there’s a LOT of estimating done for this kind of work, but it’s at least educated estimating. (I refrained from saying educated guess because that would diminish my Auburn education. War Eagle!)

Flood Study Costs & Facts of Life

The flood study in this article ultimately costs over $35,000. In my experience, the minimum flood study cost I’ve seen is in the $5000 range. It could run much higher, but that would usually involve a large area.

Unfortunately when most people are in this Fourth Situation, neighbors won’t cooperate and share the cost. I believe personally that the city or county should incur these costs, but in most cases, there aren’t funds available for this. And, since it involves a small segment of the people, it is usually not justified by people who were voted into office.

Another possible way to fund a flood study is through a Tax Assessment from the jurisdiction involved. This would require the individuals who are helped by the flood study to pay up when and if they sell their home. The idea is that being out of the flood zone would mean they get a higher price for their home than if it was still in the flood hazard zone.

USA Land Surveyor


Keith Maxwell is a Professional Engineer & Land Surveyor who has done flood studies in the past, but he got paid to do them, except for one who was a deadbeat client.

All We Are is Dust in the Wind: Map of Wind Farms

If you like maps like me, and you like wind mills (wind turbines), you’ll LOVE this link to the USGS Wind Farm map. (Yes, Dust in the Wind is one of my favorite songs, and Kansas has a number of wind farm locations.)

Wind-powered electricity generation has increased to an installed cumulative capacity of 61.5 gigawatts (GW) by September, 2014 (ref. 2), accounting for 31% of the US electricity production from renewable sources. Wind energy is currently the second largest form of renewable electric generation, behind hydroelectric generation, with installed capacity growing faster than other types of renewable energy (ref. 3).

This is quite a “scholarly” article, (ref. 1) meaning I didn’t read every word. In fact, I just skipped straight to the USGS map. (You have to use your web surfing time wisely you know.)

Since living in North Dakota for a spell, I’ve been really fascinated by Wind Power. The company I worked for then, Westwood, is a significant player in the engineering and surveying related to wind farms.

Declining Cost of Wind Energy Over TimeWind farm components and installation costs have decreased in price and increased in efficiency, competing favorably with all other forms of energy production. Utility companies have paid in the range of $0.02/kWh to $0.08/kWh, depending on the region of the US the wind farm is located. And, since production isn’t dependent on fuel cost fluctuations, long term contracts can be locked in. (ref. 4)

And, if you’re interested in more types of energy (I haven’t found a map to solar farms yet) then go to this link.

One negative aspect of a wind turbine is that birds often fly into them. That’s unfortunate, but I have a solution, which involves painting big signs on the ground that can be seen from above “WIND TURBINE AHEAD –>”. If the birds don’t see it then, it’s natural selection. (Of course I jest. Maybe we start hatching out more eagles to replenish the flock.)

I’m excited for the future of energy production and, since finding out that wind energy is less costly than nuclear energy, I have changed my thinking on building more nuclear plants. Of course, the birds would disagree with me.

References:

  1. Diffendorfer, J. E.et al. Onshore industrial wind turbine locations for the United States up to March 2014.  Data2:150060 doi:10.1038/sdata.2015.60 (2015). www.nature.com/articles/sdata201560.
  2. S. Energy Information Administration. electric power monthly with data from September 2014. www.eia.gov/electricity/monthly.
  3. S. Energy Information Administration. Monthly energy review: November 2014. www.eia.gov/totalenergy/data/monthly/index.cfm.
  4. AWEA, “The Cost of Wind Energy in the U.S.” awea.org/Resources/Content.aspx?ItemNumber=5547

USA Land Surveyor

J. Keith Maxwell is a Professional Land Surveyor licensed in Alabama. He frequently thinks of solutions to our biggest problems, like the bird thing above.

Fundamentals of Land Surveys and Boundary Disputes

Click here to view original web page at Fundamentals of Land Surveys and Boundary Disputes

Land surveying and boundary disputes date from the earliest European settlers in what is now the U.S. This comment provides a brief and incomplete educational overview of the legal aspects of this process. Always consult an experienced attorney and surveying and engineering professionals in specific situations. The Public Land Survey System reflects U.S. history with the original Atlantic seaboard colonies and Texas excluded and a patchwork of other states grouped together starting with the federal Northwest Ordinance in 1787. Revolutionary War and subsequent war veterans frequently received land script […]

Surveyor’s Footsteps: Make Your Competition Rich

land survey pricingClick here to view original web page at Surveyor’s Footsteps: Make Your Competition Rich

“A rising tide lifts all boats.” This ought to be the case with the incomes of land surveying firms, but it is not necessarily so. There seems to be a lag between our surveying ship lifting and the rest of the economy. I believe this is due in part to our approach in how we bid out our services.

This morning my wife started her day at the endodontist to see if one of her teeth could be saved. The crown had come off and there was extensive decay, […]

I often hear supply and demand referred to with regard to the cost of products and services. With the average age of a licensed land surveyor being 58, it suggests a diminishing supply as more licensed land surveyors reach retirement age. I’ve already pointed out our license should be in demand, which should push the price upwards.